The shaking
Buildings
A nearby earthquake could damage more Vancouver buildings than a much larger earthquake offshore. Age and construction matter, and a building that remains standing may still be unusable.
Last reviewed
A nearby earthquake could cause the most damage
In 2024, the City of Vancouver modelled what three different earthquakes would do to the city’s buildings. Each row below is a separate scenario.
| Earthquake | Buildings completely or extensively damaged | People out of their homes for more than 90 days, daytime / nighttime | Direct economic loss |
|---|---|---|---|
| M7.2 in the Georgia Strait, close to the city | 6,080 | 365,340 / 230,520 | $17 billion |
| M9.0 Cascadia, offshore | 1,440 | 140,000 / 115,850 | $3.8 billion |
| M7.0 deep under the region | 720 | 25,420 / 15,230 | $3.1 billion |
These figures cover the City of Vancouver, not the wider region. Daytime and nighttime are two versions of the same scenario. The losses are total direct damage, not the share covered by insurance.
The nearby M7.2 damages about four times as many buildings as the offshore M9.0 and causes about four and a half times the direct economic loss. Its smaller magnitude is offset by its location. It produces stronger shaking in the city.
Age and construction shape the damage
Vancouver has about 90,000 buildings. Nearly 70 per cent were built before 1990, when modern earthquake standards arrived, and about half before 1973, when there were no earthquake standards.
Five privately owned building types make up roughly a tenth of the stock but carry nearly 80 per cent of the city’s earthquake risk. They include concrete apartment buildings, wood-frame apartments, older brick homes, low-rise concrete shops and offices, and downtown office towers.
The City’s M7.2 scenario shows how differently three common types of housing perform. The figures are averages for each type, not an assessment of any individual building.
| Home | Where | People living in them | Buildings badly damaged | Residents out for more than 90 days |
|---|---|---|---|---|
| Concrete mid-rise and high-rise | West End, Downtown | 124,900 | 28% | 70% |
| Wood-frame apartments | Fairview, Kitsilano, Mount Pleasant, West End | 160,900 | not published | 64% |
| Older brick, 581 buildings | Gastown, Downtown Eastside, Chinatown | 24,700 | 35% | over 97% |
The table does not separate newer buildings from older ones. “Badly damaged” means extensively or completely damaged.
Wood-frame apartments account for 45 per cent of residential displacement in this scenario, or 103,900 people. They also hold 40 per cent of the city’s purpose-built rental housing. This is different from the familiar finding that wood-frame houses generally perform well. The City’s engineering work identifies weak walls and ground floors left open for parking as particular concerns in apartment buildings.
Downtown office towers are another concern. The model finds 29 per cent extensively or completely damaged, with nearly half of their occupants unable to return for more than 90 days.
Six neighbourhoods carry 65 per cent of the city’s building risk: the West End, the Downtown Eastside including Chinatown and Strathcona, Downtown, Kitsilano, Fairview and Mount Pleasant. In the census tracts with the most risk, roughly 70 to 75 per cent of residents rent. Tenants can ask about a building’s condition, but they cannot retrofit it themselves.
Falling walls and glass threaten the street
Older commercial streets face a different hazard. Brick walls, parapets and gable ends can fall onto pavements and roads, injuring people and blocking emergency vehicles. The City identifies this risk along streets including Hastings and Kingsway, especially in and around Downtown and the Downtown Eastside.
Unreinforced masonry is brick or concrete block built without steel reinforcing. A parapet is the section of wall above the roofline. Both can break away from an older building during strong shaking.
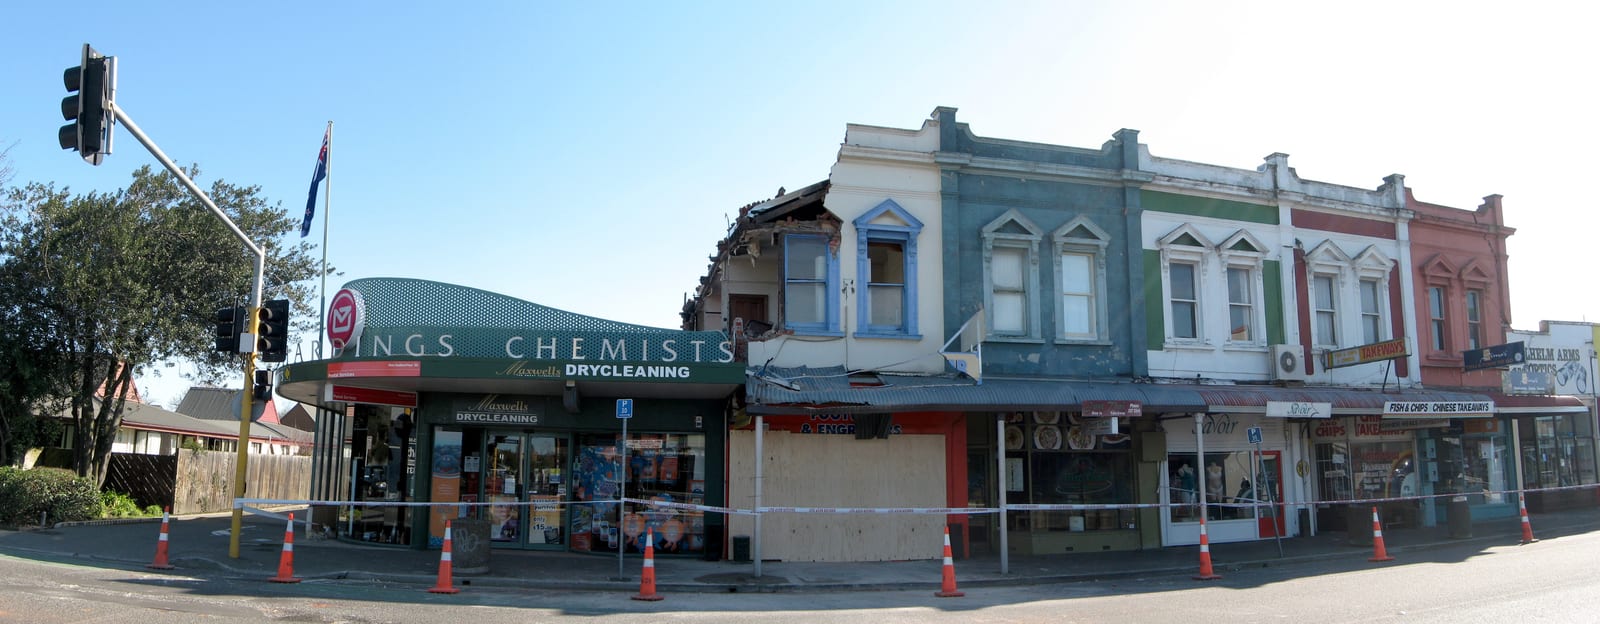
Federal modelling of a magnitude 7.0 earthquake close to Vancouver estimates 13 million tonnes of debris across the affected region, enough to obstruct streets and response work. The estimate excludes damage from aftershocks, tsunami, landslides, liquefaction and fire.
The danger is established even though no Vancouver casualty estimate exists for falling walls. In the 2011 earthquake in Christchurch, New Zealand, unreinforced masonry walls and façades caused 35 of the 42 deaths from building failures outside the two office buildings that collapsed. Twenty-six of those people were on the street or in vehicles. Christchurch shows the mechanism, not how many people would be harmed here.
The Vancouver Building By-law requires glazing in newer buildings to accommodate movement without falling out. It also sets earthquake requirements for cladding, parapets, ornaments and brick facing. Older buildings generally come under the falling-hazard rules only when an owner renovates, adds to, reconstructs or changes the use of the building. Age alone does not trigger an upgrade, and Vancouver has no standalone requirement to retrofit parapets or façades.
There is no public list of buildings at risk. The City’s five-year risk-reduction plan includes seismic screening, but it does not set a date for publishing the results or say whether individual buildings will be named.
A standing building may still be unusable
The gap between damage and displacement in the tables is important. A building does not have to collapse to become inaccessible. Damage elsewhere on the block can lead to a cordon, and every building must wait for someone qualified to inspect it.
The City expects large parts of some neighbourhoods to remain inaccessible while a limited number of inspectors and tradespeople work through damaged buildings. Even minor damage can take time to assess and repair. The Housing page covers the longer problem of finding somewhere for displaced households to live.
Most of the cost falls outside insurance
A 2013 model of an M9.0 Cascadia earthquake put the total economic loss in western Canada between roughly $66 billion and $83 billion, depending on how quickly the economy recovered. Its central estimate was about $75 billion. About $62 billion was direct damage and about $20 billion of that direct damage was insured. In other words, insurance covered roughly a third of the direct loss and just over a quarter of the central estimate for total economic loss.
Coverage is also uneven. About 55 per cent of Vancouver homeowners carry earthquake insurance, and coverage among renters is much lower. Earthquake damage cannot be assumed to be part of a home or tenant policy.
What you can do
- Find out when your building was built and what it is made of. Your landlord, strata or municipality may have the information. The City’s model shows that age and construction type both matter.
- Ask about an open parking level under a wood-frame apartment building. The City’s engineering work identifies this arrangement as a collapse risk.
- Check whether your policy includes earthquake coverage. About 55 per cent of Vancouver homeowners have it, and coverage is less common among renters. Read the policy or ask the insurer.
- Keep essential items where they remain accessible. A cordon or inspection backlog can keep people out of a standing home. Keep copies of identification and insurance documents, a medication list, glasses and other essentials somewhere you can reach if you cannot go back inside.
These steps do not change the building. They make its condition and the consequences of being unable to return less of a surprise.
The full preparedness planSources on this page
Numbered in the order they are cited. Each entry links back to where it is used.
- [1]ReportSeismic Risk and Risk Reduction in Existing Privately Owned Buildings, RTS 16091 (report plus Appendix A technical assessment), Micah Hilt with NRCan and UBC Civil EngineeringCity of Vancouver · 2024Open the document ↗
- [2]ReportBuildings Seismic Risk Reduction Action Plan, RTS 17657, incl. Appendix C (Ausenco archetype retrofit study)City of Vancouver · 2026Open the document ↗
- [3]ReportHobbs, T.E., A selection of earthquake scenarios for government planning purposes in 2021, Open File 8853, 9 p.; DOI 10.4095/329397Geological Survey of Canada · 2022Open the document ↗
- [4]Analogue eventRoyal Commission of Inquiry into Building Failure Caused by the Canterbury EarthquakesGovernment of New Zealand · 2012Open the document ↗
- [5]ReportFOI response 04-1000-20-2021-060City of Vancouver, Access to Information & Privacy · 2021Open the document ↗
- [6]ReportVancouver Building By-law 2025, Book I Volume 1City of Vancouver · 2026Open the document ↗
- [7]ReportHazard & Risk Explorer, Earthquake and Introduction chaptersCity of Vancouver (ArcGIS StoryMaps) · 2025Open the document ↗
- [8]ReportHazard Fact Sheet (English)City of Vancouver · 2024Open the document ↗
- [9]ReportStudy of Impact and the Insurance and Economic Cost of a Major Earthquake in British Columbia and Ontario/QuébecInsurance Bureau of Canada / AIR Worldwide · 2013Open the document ↗
- [10]ReportLe Pan, N., Fault Lines: Earthquakes, Insurance, and Systemic Financial Risk, Commentary No. 454C.D. Howe Institute · 2016Open the document ↗